Article Text

Abstract
Objectives This study aimed to explore the temporal relationship between blood glucose, lipids and body mass index (BMI), and their impacts on atherosclerosis (AS).
Design A prospective cohort study was designed.
Setting and participants A total of 2659 subjects from Harbin Cohort Study on Diet, Nutrition and Chronic Non-communicable Diseases, and aged from 20 to 74 years were included.
Primary and secondary outcome measures Body weight, height, fasting blood glucose (FBG) and 2-hour postprandial glucose (2-h PG), blood lipids including total cholesterol (TC), triglyceride (TG), low-density lipoprotein cholesterol (LDL-c) and high-density lipoprotein cholesterol (HDL-c) were measured at baseline and follow-up. Brachial ankle pulse wave velocity (baPWV) was examined at follow-up as a marker of AS risk. Logistic regression analysis, cross-lagged path analysis and mediation analysis were performed to explore the temporal relationships between blood glucose, lipids and BMI, and their impacts on AS risk.
Results Logistic regression analysis indicated that increased FBG, 2-h PG, TC, TG, LDL-c and BMI were positively associated with AS risk, while increased HDL-c was negatively associated with AS risk. The path coefficients from baseline blood parameters to the follow-up BMI were significantly greater than those from baseline BMI to the follow-up blood parameters. Mediation analysis suggested that increased FBG, 2-h PG, TC, TG and LDL-c could increase AS risk via increasing BMI, the effect intensity from strong to weak was LDL-c>TC>TG>FBG>2 h PG, while increased HDL-c could decrease AS risk via decreasing BMI.
Conclusions Changes in blood glucose and lipids could cause change in BMI, which mediated the impacts of blood glucose and lipids on AS risk. These results highlight the importance and provide support for the early and comprehensive strategies of AS prevention and control.
- body mass index
- chronic disease
- lipid disorders
- obesity
- observational study
Data availability statement
All data relevant to the study are included in the article or uploaded as supplementary information.
This is an open access article distributed in accordance with the Creative Commons Attribution Non Commercial (CC BY-NC 4.0) license, which permits others to distribute, remix, adapt, build upon this work non-commercially, and license their derivative works on different terms, provided the original work is properly cited, appropriate credit is given, any changes made indicated, and the use is non-commercial. See: http://creativecommons.org/licenses/by-nc/4.0/.
Statistics from Altmetric.com
STRENGTHS AND LIMITATIONS OF THIS STUDY
The study was a large prospective cohort study.
The study simultaneously analysed the temporal relationships between blood glucose, lipids and body mass index (BMI) and their impacts on atherosclerosis (AS) risk.
In the study, brachial ankle pulse wave velocity was used to access AS risk. Although it was more convenient for the management of high AS risk population, it also somewhat overestimated the effects of various factors on AS risk.
When assessing the effect of blood glucose on AS, the lack of haemoglobin a1c data might lead to inaccurate results due to ignoring the influence of external factors such as dietary.
Although BMI and waist circumference (WC) were the most common measures of obesity, there was really no way to completely replace obesity, and we still needed further research to supplement the relationship between obesity-related body composition indicators and AS, and to verify the relationship between ‘BMI and WC’ and ‘fat mass and lean mass’.
Introduction
Atherosclerosis (AS), a chronic inflammatory disease of the arteries, is the major cause of cardiovascular diseases.1 The Global Burden of Disease study shows that there are 182 million prevalent cases of ischaemic heart disease and 101 million prevalent cases of strokes in 2019.2 During the previous COVID-19 pandemic, cardiovascular disease was shown to significantly increase the risk of severe symptoms and mortality in COVID-19 patients.3 To reduce the burden of people’s health and social economy, it is necessary to prevent atherosclerotic cardiovascular diseases, such as ischaemic heart disease and stroke.
Previous studies have indicated that hyperglycaemia, dyslipidaemia and obesity are the common and important risk factors of AS.4–6 Although significant positive correlations between blood glucose, lipids and obesity have been observed,7 8 it is unknown which one is the precursor or whether the temporal relationships between them are bidirectional. Therefore, it is necessary to clarify the temporal relationships between them because different temporal relationships may result in different intervention strategies for reducing the burden of AS.
Diabetes mellitus, dyslipidaemia and obesity are all chronic metabolic disorders and they share some common pathogenic mechanisms including insulin resistance (IR) and inflammation. Studies have speculated that these metabolic disorders can influence each other.9 10 Obesity can lead to diabetes through IR mediated by continuously elevated plasma free fatty acid levels,11 and also through chronic inflammatory responses in adipose tissue.12 On the contrary, it has been reported that IR inherent in muscle and islet alpha cells in type 2 diabetes mellitus (T2DM) can increase glucose and insulin release, which in turn promotes glucose conversion to fat and accumulation, making T2DM more prone to obesity.13 The same controversy also exists between dyslipidaemia and obesity.8 These results collectively suggested that the temporal relationships between elevated blood glucose, lipids and obesity are probably far from straightforward, just like a ‘chicken-and-egg’ question.
In addition, it is also notable that these longitudinal studies have used conventional longitudinal analysis models which are usually carried out based on the study hypothesis favoured a simple one directionally temporal relationship. They can’t fully explain the complicated interactions between two parameters. In this study, we used a cross-lagged path analysis to assess the temporal relationships between elevated blood glucose, lipids and body mass index (BMI). According to this theoretical model, if the relationships between elevated blood glucose, lipids and BMI were bidirectional, they would predict each other, and their cross-lagged path coefficients would not be significantly different. However, if elevated blood glucose, lipids and BMI have underlying temporal relationships, the predictor should predict the consequent variable, and the cross-lagged path coefficient of the predictor should be significantly greater than that of the consequent variable. This theoretical model has been successfully used to analyse the temporal relationship between inter-related variables in population-based studies from the perspective of pathophysiology and metabolism.14–16 Further, this study also intended to examine whether the temporal relationships between elevated blood glucose, lipids and BMI influence future AS risk. In addition, mediation analyses were also used to examine whether there were any mediation effects linking the temporal relationships to future AS risk.
Materials and methods
Design
A prospective cohort study was used in this study.
Study population
The subjects were from the Harbin Cohort Study on Diet, Nutrition and Chronic Non-communicable Diseases.17 Residents who had lived in their communities for more than 2 years and without cancer or type I diabetes were recruited in the cohort. A total of 9734 subjects aged 20–74 years were recruited through in-person survey in 2010. During 2015 to 2016, 8913 subjects completed the first in-person follow-up survey, with a response rate of 91.6% and an average follow-up of 5.3 years, of which 4968 subjects were tested for brachial ankle pulse wave velocity (baPWV). After excluding 1489 subjects who reported having T2DM and/or control blood glucose and 603 subjects who reported having coronary heart disease and/or stroke at baseline, whose medication and changes in dietary behaviour after disease diagnosis had an effect on blood glucose, lipids and BMI, and 217 subjects with incomplete blood glucose, lipids and/or BMI data, a total of 2659 subjects were included in the study (online supplemental figure S1).
Supplemental material
Questionnaire data collection
Detailed in-person interviews were administered by trained personnel using a structured questionnaire to collect information on demographic characteristics, dietary habits, lifestyles and physical condition at both baseline and follow-up surveys. The detailed information included age, sex, smoking, alcohol consumption, labour intensity, total energy intake, disease history and taking medicines or health supplements in the past 12 months.
Anthropometric measurements and biochemical assessments
Anthropometric measurements, including height and weight, waist circumference (WC) were taken by well-trained examiners, with subjects wearing light, thin clothing and no shoes. Body weight and height were measured to the nearest 0.1 kg and 0.1 cm, respectively. BMI was calculated as weight (kg) divided by the square of the height in metres (m2). Fasting and postprandial (2 hours after oral 75 g glucose loading) blood samples were taken from all subjects at baseline and follow-up. Fasting blood glucose (FBG) and 2-hour postprandial glucose (2-h PG), blood lipids including total cholesterol (TC), triglyceride (TG), low-density lipoprotein cholesterol (LDL-c) and high-density lipoprotein cholesterol (HDL-c) were measured using an automatic biochemistry analyser (Hitachi, Tokyo, Japan).
Outcome definition
In the study, AS risk was evaluated by baPWV, an ideally non-invasive marker for detecting arterial stiffness18 19 which was a characteristic feature of atherosclerotic pathologies.20 baPWV has gradually become an indicator of AS risk monitoring and screening.21 Because it is easier to operate than other non-invasive automatic devices, and can be measured using only pressure cuff on the arms and ankles, baPWV has been used in the clinically and in large population.22 baPWV was assessed using a volume plethysmography device (VP-1000, PWV/ABI; Colin Co., Komaki, Japan) in a quiet and comfortable environment. Measurements were performed on the subject in a supine position after a rest at least 5 min, with pneumatic cuffs wrapped around both sides of the brachia and ankles, electrocardiograph electrodes sandwiched both wrists and a microphone was placed on the left edge of the sternum to detect heart sounds. Left and right baPWV were measured, and the average value was used for analysis, and baPWV was dichotomised at a cut-off point of baPWV=1400 cm/s, representing different risk of AS (baPWV ≤1400 cm/s was low AS risk; baPWV >1400 cm/s was high AS risk).23
Statistics analysis
Data were expressed as mean±SD for continuous variable and frequency (%) for categorical variable. One-way analysis of variance (ANOVA) and χ2 test were performed to compare the differences between subjects with low and high AS risk. Logistic regression analysis was performed to validate the associations between baseline and follow-up blood parameters (FBG, 2-h PG, TC, TG, HDL-c and LDL-c), BMI and AS risk, adjusted for age, sex, drinking, smoking, labour intensity and total energy intake. To explore the temporal relationships between blood parameters and BMI, cross-lagged path analysis was performed using IBM SPSS Amos V.24.0 in this study. Potential confounders included age, sex, drinking, smoking, labour intensity and total energy intake. The cross-lagged path models were estimated based on the correlation matrix using the maximum likelihood method. The differences between β 1 and β 2 derived from the standardised variables were tested using Fisher Z test.
Once the temporal relationships between FBG, 2-h PG, TC, TG, HDL-c, LDL-c and BMI had been established, a mediation analysis was constructed to examine whether the relationships between blood parameters and BMI influence AS risk using R package lavaan.24 Subsequently, a multiple mediation analysis was performed to compare the effect intensity of potential parameters on AS risk. All models adjusted for age, sex, drinking, smoking, labour intensity and total energy intake.
Four sensitivity analyses were performed in this study. First sensitivity analysis was performed to evaluate sensitivity to the distributions of cross-lagged path coefficients using bootstrap simulation in the cross-lagged path analyses. Second sensitivity analysis was performed to validate the temporal relationships from cross-lagged path analysis using general liner model. Third sensitivity analysis was performed to explore the impacts of the relationships between blood parameters and WC on AS risk using mediation analysis, to validate the impacts of the relationships between blood parameters and BMI on AS risk. The fourth sensitivity analysis was performed to compare the effect intensity of the relationships between blood parameters and WC on AS risk using multiple mediation, to verify the effect intensity of the relationships between blood parameters and BMI on AS risk. All models were adjusted for age, sex, drinking, smoking, labour intensity and total energy intake. R V.3.5.2 (http://www.r-project.org/) and IBM SPSS Amos V.24.0 were used in statistics analysis. A two-sided p <0.05 was considered statistically significant.
Patient and public involvement
Patients or the public were not involved in the design, or conduct, or reporting, or dissemination plans of our research.
Results
Characteristics of the subjects
With baPWV=1400 cm/s as the cut-off point, subjects were divided into low and high AS risk groups, the average baPWV were 1238.79 cm/s and 1671.16 cm/s, respectively. Baseline and follow-up characteristics of the subjects with different AS risk are shown in table 1. Compared with the subjects with low AS risk, the subjects with high AS risk were older, and had higher baseline and follow-up FBG, 2-h PG, TC, TG, LDL-c, BMI, WC and lower baseline HDL-c. There were higher percentage of men and smokers in subjects with high AS risk.
Baseline and follow-up characteristics of the subjects with different atherosclerosis (AS) risk
Logistic regression analysis between blood parameters, BMI and AS risk
Table 2 showed the associations between baseline and follow-up blood parameters, BMI and AS risk, adjusted for age, sex, drinking, smoking, labour intensity and total energy intake. Baseline and follow-up FBG, 2-h PG, TC, TG, LDL-c and BMI were all positively associated with AS risk, while baseline and follow-up HDL-c were reversely associated with AS risk.
The associations between baseline and follow-up potential parameters and the risk of atherosclerosis (AS)
Cross-lagged path analysis of FBG, 2-h PG, TC, TG, HDL-c, LDL-c and BMI
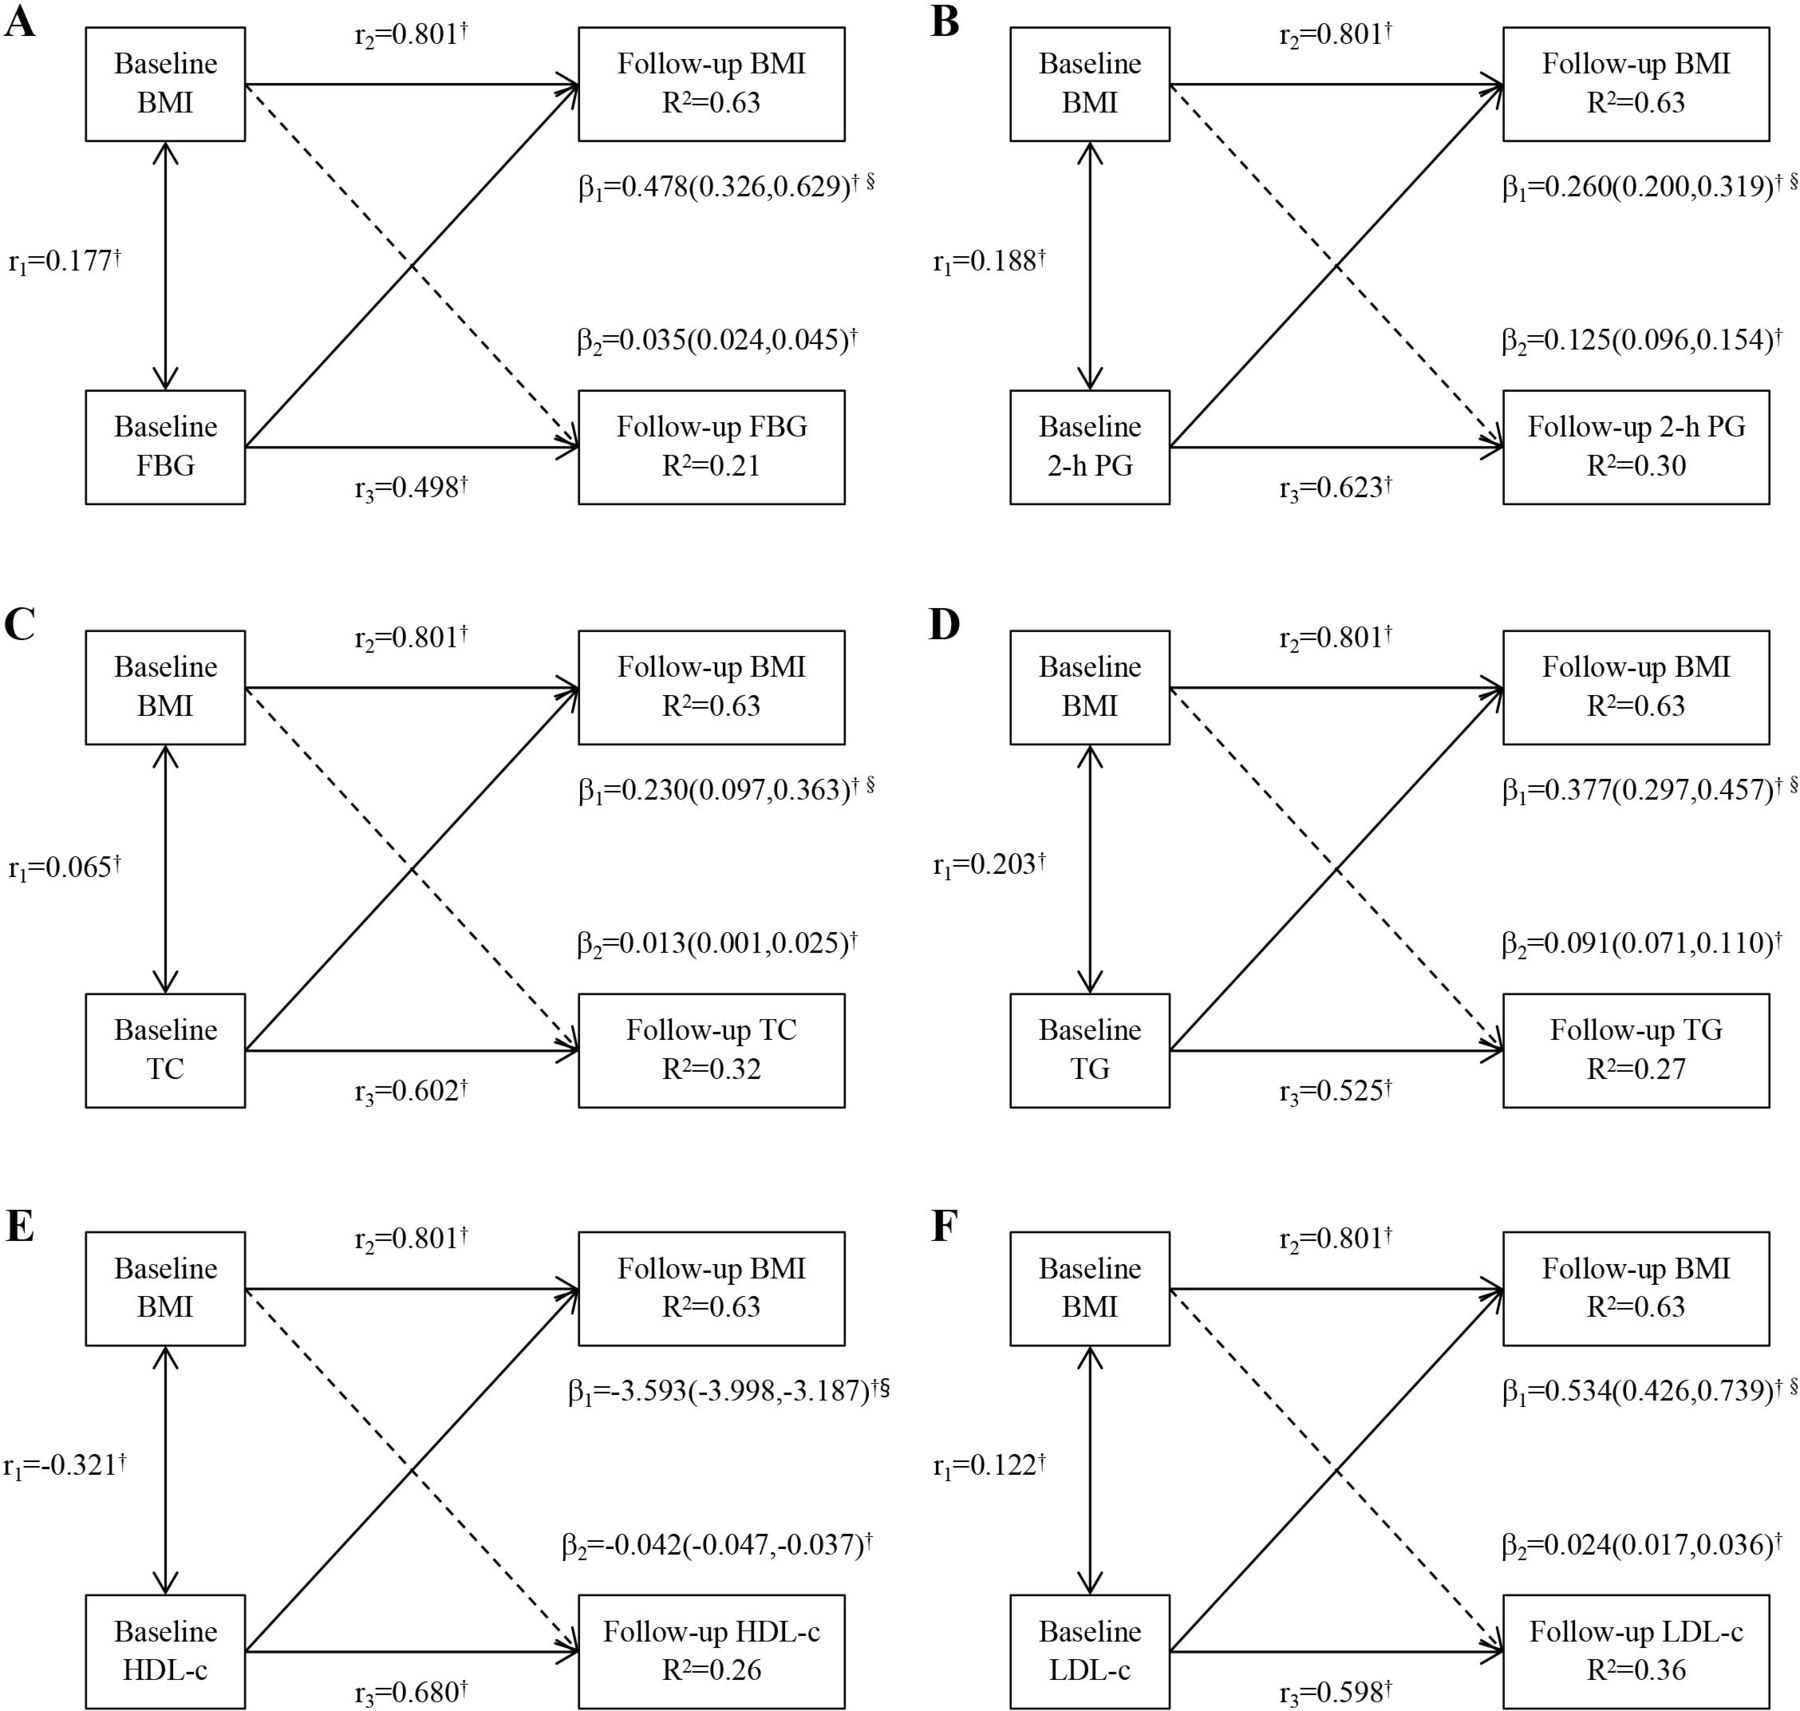
Figure 1 presented cross-lagged path analysis of the associations between FBG, 2-h PG, TC, TG, HDL-c, LDL-c and BMI. After adjusting for age, sex, drinking, smoking, labour intensity and total energy intake, the path coefficients from baseline FBG, 2-h PG, TC, TG, HDL-c and LDL-c to the follow-up BMI (β 1=0.478 for FBG, β 1=0.260 for 2-h PG, β 1=0.230 for TC, β 1=0.377 for TG, β 1=−3.593 for HDL-c, β 1=0.534 for LDL-c; all p <0.001) were significantly greater than the path coefficients from baseline BMI to the follow-up FBG, 2-h PG, TC, TG, HDL-c and LDL-c (β 2=0.035 for FBG, β 2=0.125 for 2-h PG, β 2=0.013 for TC, β 2=0.091 for TG, β 2=−0.042 for HDL-c, β 2=0.024 for LDL-c; all p <0.001), with all p <0.001 for the differences between β 1 and β 2 as shown in online supplemental table S1.
Supplemental material

Cross-lagged path analysis of the associations between (A) FBG, (B) 2-h PG, (C) TC, (D) TG, (E) HDL-c, (F) LDL-c and BMI, adjusted for age, sex, drinking, smoking, labour intensity and total energy intake. β 1 represents cross-lagged path coefficients from baseline FBG, 2-h PG, TC, TG, HDL-c or LDL-c to follow-up BMI; β 2 represents cross-lagged path coefficients from baseline BMI to follow-up FBG, 2-h PG, TC, TG, HDL-c or LDL-c; r 1 represents synchronous correlations; r 2 and r 3 represent tracking correlations; and R 2 represents variance explained. †P <0.001 for coefficients being different from 0. §Difference between β 1 and β 2 for being different from 0. BMI, body mass index; FBG, fasting blood glucose; HDL-c, high-density lipoprotein cholesterol; LDL-c, low-density lipoprotein cholesterol; TC, total cholesterol; TG, triglyceride; 2-h PG, 2-hour postprandial glucose.
Mediation analysis
Figure 2 showed mediation analysis of the effects of baseline FBG, 2-h PG, TC, TG, HDL-c and LDL-c on AS risk via follow-up BMI, adjusted for age, sex, drinking, smoking, labour intensity and total energy intake. The total effects of baseline FBG, 2-h PG, TC, TG, HDL-c and LDL-c on AS risk measured as standardised regression coefficient (β tot=0.033 for FBG, β tot=0.018 for 2-h PG, β tot=0.046 TC, β tot=0.030 for TG, β tot=−0.132 for HDL-c, β tot=0.053 for LDL-c, all p <0.001) were estimated without follow-up BMI in the models. The direct effects of baseline FBG, 2-h PG, TC, TG, HDL-c and LDL-c on AS risk were all statistically significant (β Dir=0.022 for FBG, β Dir=0.013 for 2-h PG, β Dir=0.040 for TC, β Dir=0.023 for TG, β Dir=−0.069 for HDL-c, and β Dir=0.042 for LDL-c, all p <0.001). The β 1 and β 2 were used to calculate the indirect effects of baseline FBG, 2-h PG, TC, TG, HDL-c and LDL-c (β ind=0.011 for FBG, β ind=0.005 for 2-h PG, β ind=0.006 for TC, β ind=0.007 for TG, β ind=−0.063 for HDL-C, β ind=0.011 for LDL-c; all p <0.001) on AS risk via follow-up BMI, respectively. The percentages of the indirect effects of baseline FBG, 2-h PG, TC, TG, HDL-c and LDL-c on AS risk via follow-up BMI were estimated at 33.3%, 27.8%, 13.0%, 23.3%, 47.7% and 20.8%, respectively.

Mediation analysis of the effects of baseline (A) FPG, (B) 2-h PG, (C) TC, (D) TG, (E) HDL-c or (F) LDL-c on atherosclerosis (AS) risk via follow-up BMI, adjusted for age, sex, drinking, smoking, labour intensity and total energy intake. Left and right brachial ankle pulse wave velocity (baPWV) was measured, and the average value was used for analysis, and baPWV was dichotomised at a cut-off point of baPWV=1400 cm/s, representing different AS risk (baPWV ≤1400 cm/s was low AS risk, baPWV >1400 cm/s was high AS risk).†P <0.05 for coefficients being different from 0. BMI, body mass index; FBG, fasting blood glucose; HDL-c, high-density lipoprotein cholesterol; LDL-c, low-density lipoprotein cholesterol; TC, total cholesterol; TG, triglyceride; 2-h PG, 2-hour postprandial glucose.
Multiple mediation analysis
From the above results, we found that increased FBG, 2-h PG, TC, TG and LDL-c could increase AS risk via increasing BMI, while increased HDL-c could decrease AS risk via decreasing BMI. To compare the indirect effects intensity of baseline blood parameters positively associated with AS risk, a multiple mediation analysis was performed (figure 3). The standardised regression coefficient of total effect of baseline FBG, 2-h PG, TC, TG and LDL-c on AS risk without follow-up BMI in the models was 0.138, and p <0.001. The standardised regression coefficient of direct effects of FBG, 2-h PG, TC, TG and LDL-c was 0.005, 0.009, 0.002, 0.022 and 0.042 (all p <0.001), respectively. The standardised regression coefficient of indirect effects of baseline FBG, 2-h PG, TC, TG and LDL-c on AS risk via follow-up BMI was 0.005, 0.003, 0.017, 0.009 and 0.024 (all p <0.001), respectively. The percentages of the indirect effects of baseline FBG, 2-h PG, TC, TG and LDL-c on AS risk via follow-up BMI were 3.6%, 2.2%, 12.3%, 6.5% and 17.4%, respectively. Therefore, the indirect effect intensity of baseline blood parameters on AS risk via follow-up BMI from strong to weak was LDL-c>TC>TG>FBG>2-h PG.

Multiple mediation analysis of the effects of baseline FBG, 2-h PG, TC, TG and LDL-c on atherosclerosis (AS) risk via follow-up BMI, adjusted for age, sex, drinking, smoking, labour intensity and total energy intake. Left and right brachial ankle pulse wave velocity (baPWV) was measured, and the average value was used for analysis, and baPWV was dichotomised at a cut-off point of baPWV=1400 cm/s, representing different AS risk (baPWV ≤1400 cm/s was low AS risk, baPWV >1400 cm/s was high AS risk).†P <0.05 for coefficients being different from 0. BMI, body mass index; FPG, fasting plasma glucose; LDL-c, low-density lipoprotein cholesterol; TC, total cholesterol; TG, triglyceride; 2-h PG, 2-hour postprandial glucose.
Sensitivity analysis
Four sensitivity analyses were conducted in the study. The first sensitivity analysis obtained 95% percentile bootstrap CIs to evaluate sensitivity to the distributions of cross-lagged path coefficients shown in figure 1. The results indicated that both β 1 (the path coefficients from baseline FBG, 2-h PG, TC, TG, HDL-c and LDL-c to the follow-up BMI) and β 2 (from baseline BMI to the follow-up FBG, 2-h PG, TC, TG, HDL-c and LDL-c) were statistically significant, and further verified that β 1 were significantly greater than β 2.
The second sensitivity analysis verified yearly variations in FBG, 2-h PG, TC, TG, HDL-c, LDL-c and BMI according to quartiles of their baseline values to validate the results of cross-lagged path analyses, adjusted for age, sex, drinking, smoking, labour intensity and total energy intake (online supplemental figure S2). The yearly variation in BMI significantly increased with the increase of quartiles of baseline FBG, 2-h PG, TC, TG, LDL-c and the decrease of quartiles of baseline HDL-c (p for trend<0.001 for FBG, p for trend =0.002 for 2-h PG, p for trend =0.007 for TC, p for trend =0.007 for TG, p for trend =0.005 for HDL-c, p for trend =0.009 for LDL-c); however, the variations in FBG, 2-h PG, TC, TG, HDL-c and LDL-c did not show significant trend with the variation of quartiles of baseline BMI (p for trend =0.554 for FBG, p for trend =0.725 for 2-h PG, p for trend =0.207 for TC, p for trend =0.624 for TG, p for trend =0.635 for HDL-c, p for trend =0.863 for LDL-c). These results were consistent with the unidirectional relationships from baseline FBG, 2-h PG, TC, TG, HDL-c, LDL-c to follow-up BMI shown in figure 1.
Supplemental material
The third sensitivity analysis was performed to analyse the impacts of the associations between FBG, 2-h PG, TC, TG, HDL-c, LDL-c and WC on AS risk using mediation analysis, to validate the impacts of the relationships between FBG, 2-h PG, TC, TG, HDL-c, LDL-c and BMI on AS risk, adjusted for age, sex, drinking, smoking, labour intensity and total energy intake (online supplemental figure S3). The standardised regression coefficient of total effects of baseline FBG, 2-h PG, TC, TG, HDL-c and LDL-c on AS risk without follow-up WC in the models was 0.033, 0.018, 0.045, 0.030, –0.131 and 0.052 (all p <0.001), respectively. The standardised regression coefficient of direct effects of baseline FBG, 2-h PG, TC, TG, HDL-c and LDL-c on AS risk was 0.024, 0.013, 0.038, 0.023, –0.076 and 0.040 (all p <0.001), respectively. The standardised regression coefficient of indirect effects of baseline FBG, 2-h PG, TC, TG, HDL-c and LDL-c on AS risk via follow-up WC was 0.009, 0.005, 0.007, 0.007, –0.055 and 0.012 (all p <0.001), respectively. The percentages of the indirect effects of baseline FBG, 2-h PG, TC, TG, HDL-c and LDL-c on AS risk via follow-up WC were estimated at 27.3%, 27.8%, 15.6%, 23.3%, 42.0% and 23.1%, respectively. These results indicated that increased FBG, 2-h PG, TC, TG and LDL-c could increase AS risk via increasing WC, while increased HDL-c could decrease AS risk via decreasing WC, which were consistent with the results shown in figure 2.
Supplemental material
The fourth sensitivity analysis was performed to compare the effect intensity of the associations between FBG, 2-h PG, TC, TG, LDL-c and WC on AS risk using multiple mediation, to validate the effect intensity of the relationships between FBG, 2-h PG, TC, TG, LDL-c and BMI on AS risk, adjusted for age, sex, drinking, smoking, labour intensity and total energy intake (online supplemental figure S4). The standardised regression coefficient of total effect of baseline FBG, 2-h PG, TC, TG and LDL-c on AS risk without follow-up WC in the models was 0.137, and p <0.001. The standardised regression coefficient of direct effects of FBG, 2-h PG, TC, TG and LDL-c on AS risk was 0.007, 0.009, 0.004, 0.023 and 0.043 (all p <0.001), respectively. The standardised regression coefficient of indirect effects of baseline FBG, 2-h PG, TC, TG and LDL-c on AS risk via follow-up WC was 0.003, 0.002, 0.015, 0.008 and 0.023 (all p <0.001), respectively. The percentages of the indirect effects of baseline FBG, 2-h PG, TC, TG and LDL-c on AS risk via follow-up WC were 2.2%, 1.5%, 10.9%, 5.8% and 16.8%, respectively. Therefore, the indirect effect intensity of baseline blood parameters positively associated with the risk of AS from strong to weak was LDL-c>TC>TG>FBG>2-h PG. These results were consistent with the results shown in figure 3.
Supplemental material
Discussion
In this study, we explored the temporal relationships between FBG, 2-h PG, TC, TG, HDL-c, LDL-c and BMI, and their impacts on AS risk. Our findings indicated that the temporal relationships were from baseline FBG, 2-h PG, TC, TG, HDL-c and LDL-c to follow-up BMI. What’s more, increased FBG, 2-h PG, TC, TG and LDL-c could increase AS risk via increasing BMI, while increased HDL-c could decrease AS risk via decreasing BMI. The effect intensity of blood parameters positively associated with AS risk from strong to weak was LDL-c>TC>TG>FBG>2-h PG.
AS is a major pathological basis of cardiovascular disease. In the prevention and control of cardiovascular diseases, actively exploring the risk factors of AS as the prevention and control targets has always been a research hotspot. Current studies have widely recognised that diabetes, dyslipidaemia and obesity are the most important risk factors of AS.25–28 Previous studies have confirmed that diabetes, dyslipidaemia and obesity can significantly increase the risk of AS.29–31 When these abnormal states exist at the same time, AS risk can be further increased.32–34 The results of logistic regression analysis in the present study found that baseline and follow-up FBG, 2-h PG, TC, TG, LDL-c and BMI were positively associated with the risk of AS, while baseline and follow-up HDL-c were reversely associated with the risk of AS, which were consistent with previous studies.
Since diabetes, dyslipidaemia and obesity share some common pathological bases and coexist in many conditions, the relationships between them have been the focus of research. However, the results of the study on the sequence of diabetes, dyslipidaemia and obesity are inconsistent with previous results,35 36 which may be due to the differences in study design, lifestyle changes after diagnosis, neglect of the role of hypoglycaemic and lipid-lowering drugs in obesity,37 38 and other factors. It’s also possible that while BMI is the most common indicator for assessing and diagnosing obesity, because it fails to discriminate between fat mass and lean mass, there’s no way to completely replace obesity.39 We will increase the corresponding body composition index in the follow-up. From the perspective of early prevention and control of the disease, it is necessary to clarify the temporal relationship between them for the development of early prevention and control strategies of AS. In this study, we excluded subjects who reported having T2DM and/or control blood glucose and subjects who reported having coronary heart disease and/or stroke at baseline, whose medication and changes in dietary behaviour after disease diagnosis had an effect on blood glucose, lipids and BMI, which made it easier for us to accurately explore the temporal relationship between diabetes, dyslipidaemia and obesity. In addition, cross-lagged path analysis was used in the study to objectively and accurately analyse the temporal relationships between blood glucose and lipids and BMI. By comparing the path coefficients β 1 and β 2, the temporal relationships between blood glucose and lipids and BMI were determined. The results of cross-lagged path analysis suggested that the temporal relationships were from baseline blood glucose and lipids to follow-up BMI.
To explore the impacts of the temporal relationships on AS risk, and to further clarify the key point of prevention and control, mediation analysis was performed in the study. Mediation analysis was first proposed in psychological research,40 and nowadays, is widely used in epidemiology, especially in studies of molecular mechanism of disease causation, response of clinical treatments and socioeconomic status.41 It is typically applied to assess the extent to which the effect of an exposure is explained, or is not explained by a given set of hypothesised mediators (also called intermediate variables).42 The results of this study showed that changes in blood glucose and lipids could not only directly affect AS risk, but also indirectly affect AS risk via change in BMI. The results of mediation analysis showed that the percentages of the indirect effects of baseline FBG, 2-h PG, TC, TG, HDL-c and LDL-c on AS risk via follow-up BMI were 33.3%, 27.8%, 13.0%, 23.3%, 47.7% and 20.8%, respectively. These findings indicated that BMI were important mediators in the relationships between blood glucose and lipids and AS risk. To compare the indirect effects intensity of baseline blood parameters positively associated with AS risk, a multiple mediation analysis was performed. The results of multiple mediation analysis showed that the percentages of the indirect effects of baseline FBG, 2-h PG, TC, TG and LDL-c on AS risk via follow-up BMI were 3.6%, 2.2%, 12.3%, 6.5% and 17.4%, respectively. Therefore, the indirect effect intensity of baseline blood parameters on AS risk via follow-up BMI from strong to weak was LDL-c>TC>TG>FBG>2-h PG, which indicated that the indirect effect of increased blood lipids via increasing BMI was stronger than that of increased blood glucose on AS risk. Our results were also indirectly supported by the conclusion of previous studies that AS was a chronic immunoinflammatory fibroproliferative disease of large-sized and medium-sized arteries fueled by lipid.43–45 The above results suggested that the control of increased blood glucose and lipids, as well as controlling increased BMI, was the most important points in the prevention and control of AS. The finding in our study further supported the current clinical treatment of AS mainly with statins and other lipid-lowing drugs and metformin, a hypoglycaemic drug.46 47
The results of a series of Avon Longitudinal study of Parents and Children show that arterial stiffness precedes conditions such as hyperinsulinaemia, IR, dyslipidaemia, metabolic syndrome, obesity and hypertension.48–50 The results of Framingham Heart Study, Hanzhong Adolescent Hypertension Study and Kailuan study also support the above conclusions.51–54 However, due to the lack of baseline baPWV data in this study, we cannot verify the above conclusions, but we will add relevant data collection in further follow-up and experimental studies.
The strength of this study was prospective design. Moreover, we simultaneously analysed the temporal relationships between blood glucose, lipids and BMI, and their impacts on AS. However, there were some limitations in the study. First, we used baPWV to access AS risk in the study. Although the subjects with high AS risk were better screened, the effects of various factors on AS might be somewhat overestimated. Second, when we evaluated the effects of blood glucose on AS, haemoglobin a1c data were lacking, which might lead to inaccurate results due to the influence of external factors such as dietary and exercise patterns. Third, although BMI and WC were the most common measures of obesity, there was really no way to completely replace obesity, and we still needed further research to supplement the relationship between obesity-related body composition indicators and AS, and to verify the relationship between ‘BMI and WC’ and ‘fat mass and lean mass’. Finally, the study on the temporal relationship between blood glucose, lipids and BMI was observational study based on population level, and further experimental study was still necessary.
Conclusions
In conclusion, our findings suggested that blood glucose, lipids and BMI were all associated with AS risk. Changes in blood glucose and lipids could cause change in BMI, which mediated the impacts of blood glucose and lipids on AS risk. As the risk factors, the effects of blood glucose and lipids on AS from strong to weak was LDL-c>TC>TG>FBG>2-h PG. These results highlight the importance and provide support for the comprehensive strategies of AS prevention and control.
Data availability statement
All data relevant to the study are included in the article or uploaded as supplementary information.
Ethics statements
Patient consent for publication
Ethics approval
This study was conducted according to the guidelines laid down in the Declaration of Helsinki and all procedures involving human subjects were approved by the Ethics Committee of Harbin Medical University, and written informed consent was provided by all subjects. The methods in the study were in accordance with the approved guidelines. HDNNCDS: ChiCTR-ECH-12002721. Participants gave informed consent to participate in the study before taking part.
Acknowledgments
We are grateful to all participants who took part in this study and the research team.
References
Supplementary materials
Supplementary Data
This web only file has been produced by the BMJ Publishing Group from an electronic file supplied by the author(s) and has not been edited for content.
Footnotes
Contributors LN and CS designed research and acquired funding. SJ, JL, YJ, conducted research. SJ analysed data. SJ and LN wrote the paper. LN and CS had primary responsibility for final content. All authors provided inputs and approved the final manuscript. LN is the guarantor.
Funding This research is supported by the National Natural Science Foundation of China (81872614).
Competing interests None declared.
Patient and public involvement Patients and/or the public were not involved in the design, or conduct, or reporting, or dissemination plans of this research.
Provenance and peer review Not commissioned; externally peer reviewed.
Supplemental material This content has been supplied by the author(s). It has not been vetted by BMJ Publishing Group Limited (BMJ) and may not have been peer-reviewed. Any opinions or recommendations discussed are solely those of the author(s) and are not endorsed by BMJ. BMJ disclaims all liability and responsibility arising from any reliance placed on the content. Where the content includes any translated material, BMJ does not warrant the accuracy and reliability of the translations (including but not limited to local regulations, clinical guidelines, terminology, drug names and drug dosages), and is not responsible for any error and/or omissions arising from translation and adaptation or otherwise.